Kew Gardens
Improving the user experience for What’s On and Festivals covering Kew Gardens and Wakehurst.
Product Design
Sector
Research, B2B
Service
Product Design
Team
Product Design & Research Lead: Myself
Product Manager: 1
Content Manager: 1
External Development Agency
Target audience
2.45 million annual visitors
The opportunity
To create a new page template for festivals and make improvements to the What’s On page to enhance the user experience. Solutions must be WCAG 2.0 AA-AAA compliant and documented within the Kew Design System.
What’s on desk research
Gathering data on how users interact with the what’s on pages for Kew and Wakehurst through Google analytics, click maps and heatmaps.

Device type (Google analytics):
Mobile is the prominent device type for all What's On pages, with 58-77% of usage. Desktop usage sits between 18-36% Tablet usage is minimal. Therefore, all our designs are mobile first.Accessibility filters (Google analytics and usability testing):
Accessibility filter rarely used on What’s On filter, this seemed unusual. Through usability testing, when the user clicks / taps accessibility, 0 results always appear. Further insights needed.Carousel component (HotJar screen recording and click map analysis):
Customers were getting stuck in carousels, how can this adapted to improve searchKew & Wakehurst filter use (Click & heatmaps):
3.4% Avg. ‘Search event by type’ filter has low engagement Kew & Wakehurst, mobile & desktop
<1% Avg. ‘Visit Wild at Wakehurst’ module has low engagement Kew, mobile & desktop
60% Avg. Users scrolling to view all content on What’s On Page Wakehurst, mobile & desktop
35% Avg. Users scrolling to view all content on What’s On Page Kew, mobile & desktop
Google analytics filter interaction
Date and event type
Event type
User survey
Based on desk research, I ran a user survey focussing on motivation, planning period, search method, priorities, find-ability and quality of information. The survey produced the following insights:
Planning period
Priorities
Solution
I restructured the category tags based on user and business requirements. Once the iteration was complete I tested the wireframes with the research user group and found a few takeaways:
Usability: The filter chip UI filter component had more engagement than a search bar. This was a great find before going into hifi as search is a high cost feature.
Customer need: Having filter categories that were relevant to the user more visible on mobile, test example ‘family friendly’ got positive feedback.
“The page made it clear where I could find activities which were family friendly & this to me, meant with my kids. Also the events are likely categorized into these subsections so I won’t have to spend loads of time looking for specific things to do which are family friendly”
From first click testing, I shared the results with the development team to kick off collaboration and feasibility of the change to the design. Key areas of feedback from development:
Adding date pickers into the UI filter chips added a lot of complexity for both development and the content team. Managing the calendar to ensure the date picker doesn’t go too far into the future to avoid the 0 results experience.
Balancing this feedback with user need, content volume and development build, we collaboratively removed the date picker. This approach meant the user can still select research approved date periods via chips.
Learnings
Accessibility: We removed the ‘accessible’ filter within the search due to 0 results in data tagging. However, within survey feedback, customers added a wide range of access needs, validating the need to improve search by access.
Global search: Within the survey, an equal amount of customers would go to search or what’s on to find listings, due to search improvements being out of scope, this is an area for iteration to improve the user experience.


Design system growth

Explore more work
-
![iPhone showing Plus X Innovation website, overlayed onto an image of a hardware prototyping lab]()
Plus X Innovation
-
![An outdoor poster showcasing the National Institute of Medical Herbalists]()
National Institute of Medical Herbalists
-
![iPad showing the experience centre's content library, overlayed onto a birds-eye view of Diageo experience centre]()
Diageo
-
![Iphone screens showing the iterative improvement to IMEX Events websites]()
IMEX Events
-
![Teacher sitting with child doing school work in a classroom, the Life Lessons logo is overlayed]()
Life Lessons
-
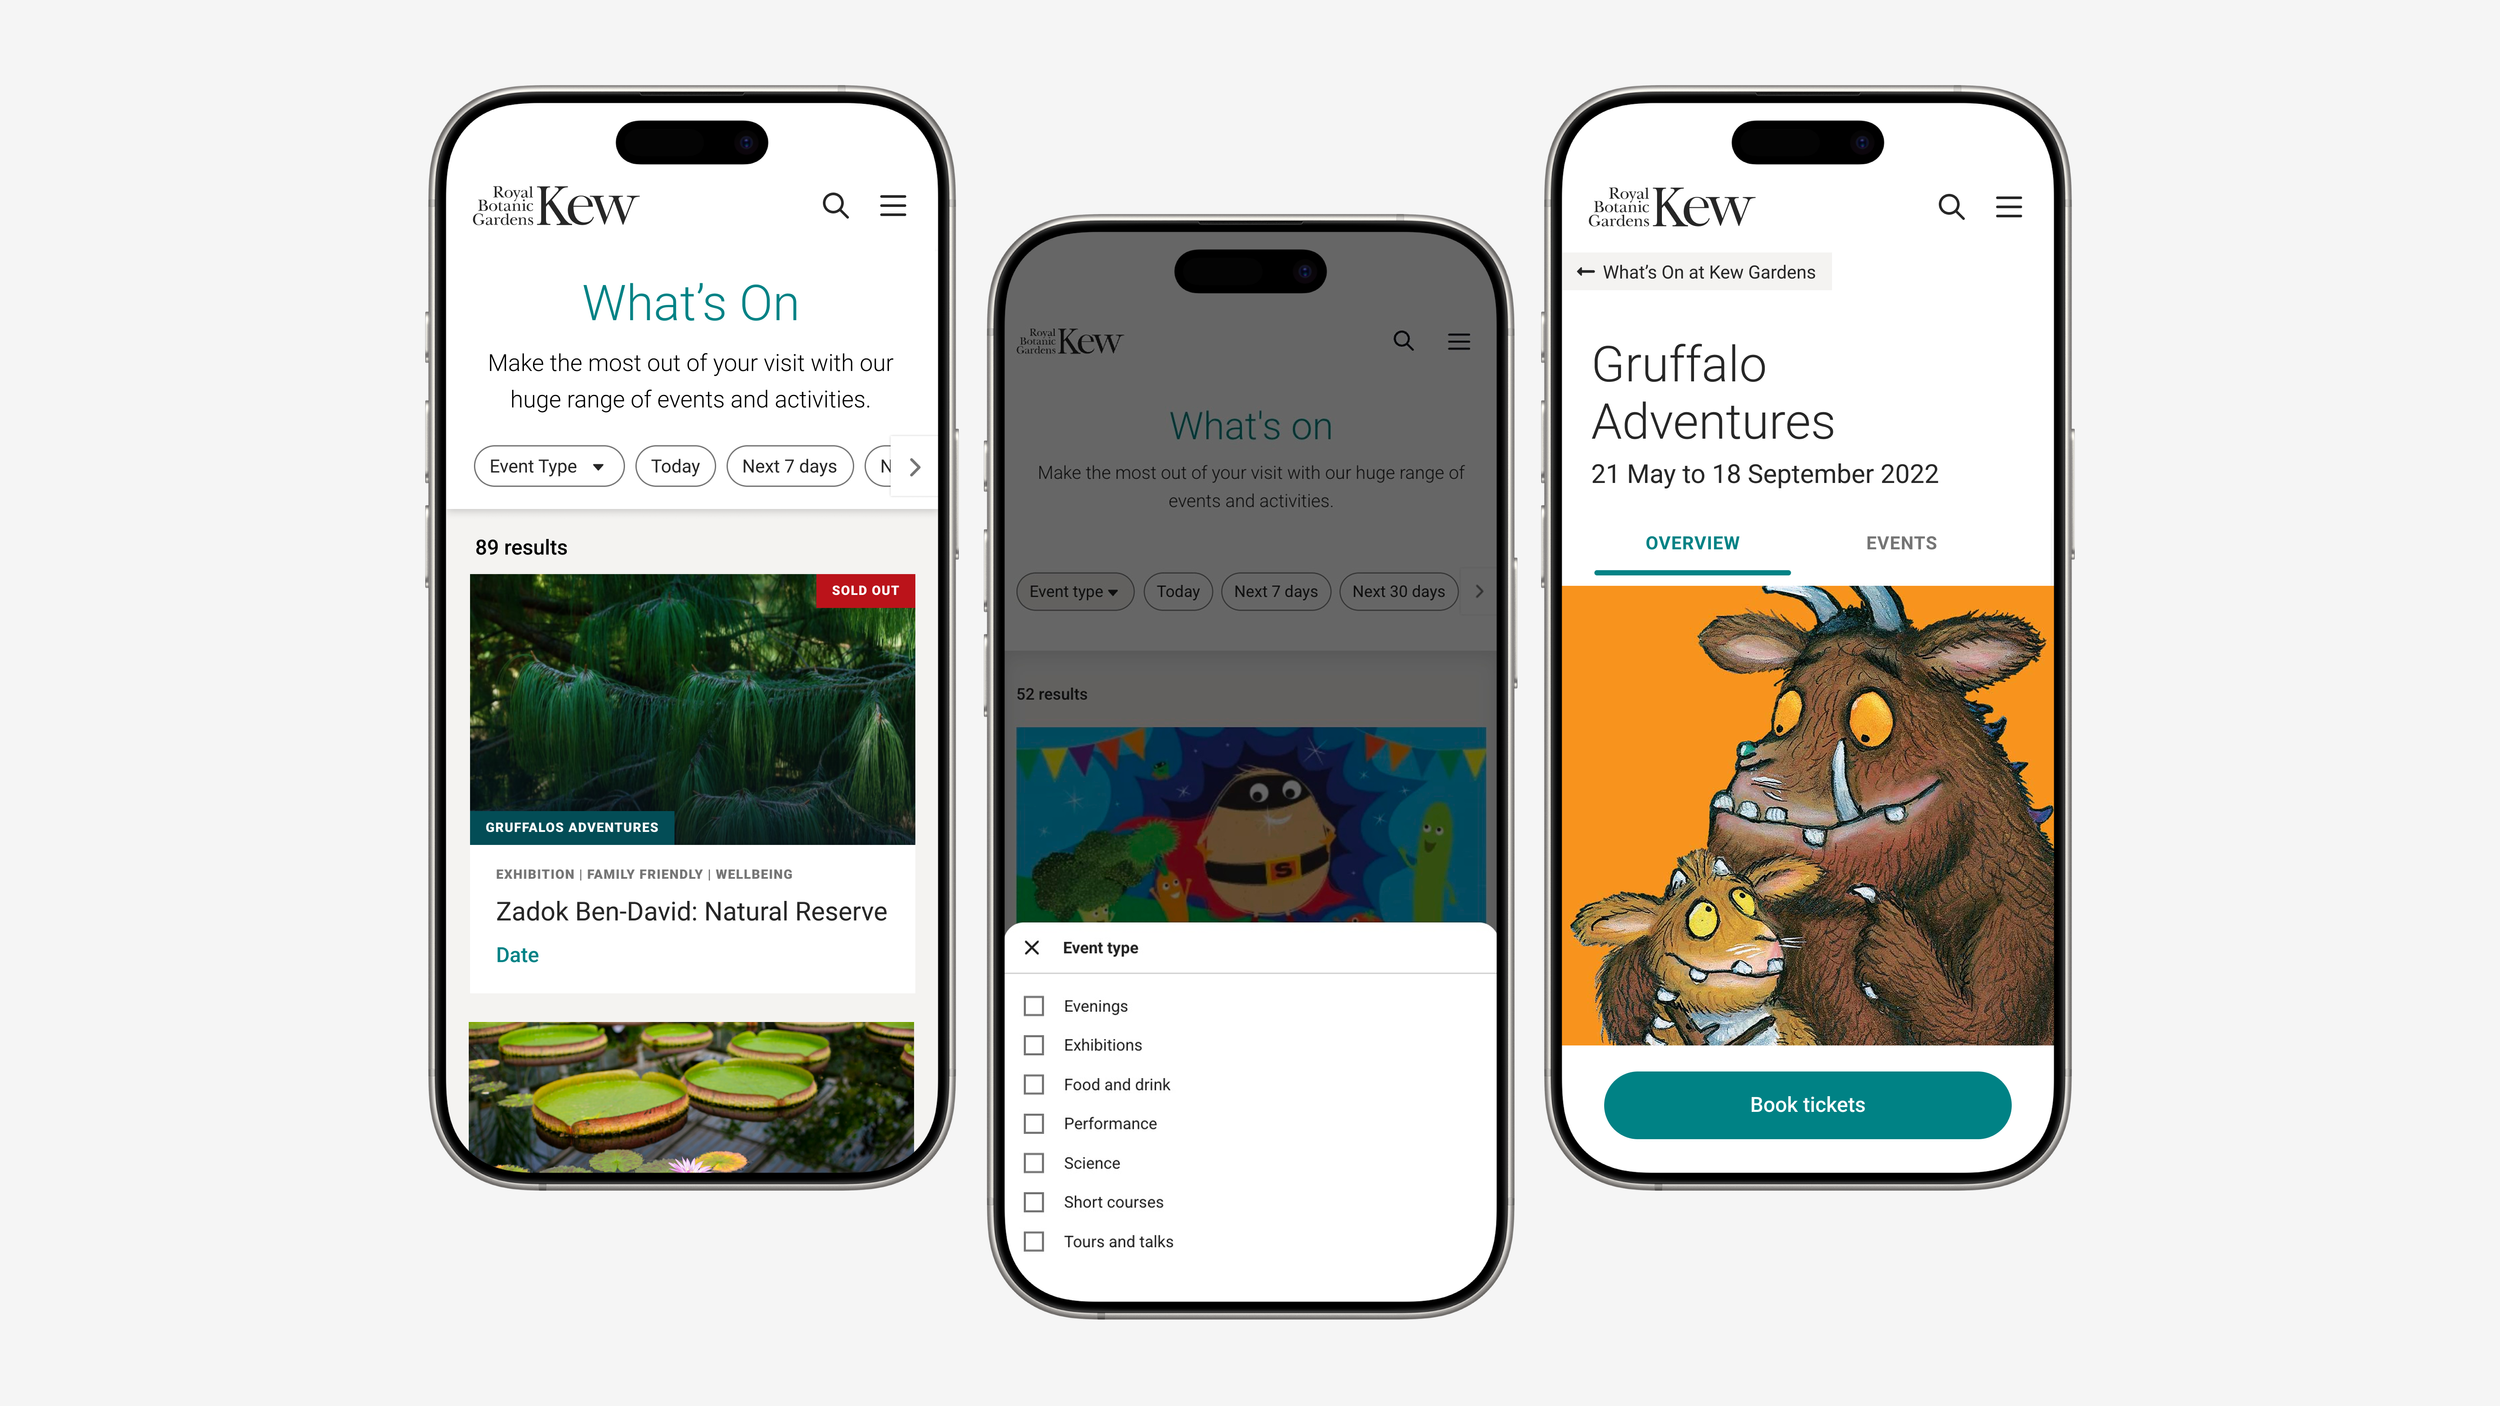
![3 iPhone screens showing the user journey for a user searching for an event at Kew Gardens]()
Kew Gardens
-
![A large screen displaying the words "Artificial Intelligence" in bold letters.]()
13 Books
-
![A variety of page and poster layouts for UCL culture]()
UCL Culture
-
![Habitus company logo overlayed onto a image of someone wearing a polar bear outfit laying on a city street with a person standing over them depicting the climate crisis]()
Habitus Insight